Your team's performance was below expectations, and your reps will not meet the sales forecast for the quarter. You believe that an increase in sales cadence might improve the performance. However, you’re confused if you should trust your gut instinct.
That’s where sales analytics prove useful. It helps you make data-backed and informed business decisions so that your sales team can grow stronger and your company can increase profitability.
In a survey of 1000+ organizations by McKinsey, fast-growing sales organizations were found to use analytics more effectively than others. Let’s get started with understanding the basics of sales data analytics.

What is Sales Analytics, and Why Does Your Sales Team Need it?
Sales analytics is using your sales data for generating actionable intelligence to improve your
.
Sales teams also use it to dissect the success of their previous sales campaigns and
.
In this context, our
can be a valuable tool for providing detailed insights and facilitating data-driven decision-making.
Regular sales data analytics keeps your sales reps accountable and aids the optimization of sales activities so that you can improve your revenue.
However, with a plethora of software, a lot of data is generated. Sales leaders and management should choose the metrics and tools they rely on to grow their business.
Leveraging various analytical methods, such as SWOT analysis, is crucial for gaining a comprehensive understanding of your sales performance and driving revenue growth.
8 Types of Sales Analytics to Take Analysis to the Next Level
McKinsey found that analytics tools are deployed across four primary sales areas. In this section, you’ll learn about the most common sales and marketing analytics types that can generate invaluable insights for growing your business.

1. Pricing Analytics
Can you pinpoint who your customers are and what value they find in your products? If you’re a large company with multiple products at different price points, you might have relied on guesswork to understand your customers’ needs, motivations, and willingness to pay. In doing so, you may have missed opportunities to optimize your revenue.
Smart pricing analytics can help you handle your past performance. You can identify the price tiers that work for your customers and modify the pricing accordingly to improve profitability. Here are the top two pricing metrics that you need to track:
1. Willingness to Pay (WTP)/Price Sensitivity
This metric tells you the maximum amount a customer will pay for your products or services. For instance, look at the results of a case study of the YouTube premium below that our friends at Paddle (previously Price Intelligently) did.

We can establish that:
- YouTube's old demographic is less likely to pay to use the platform; its target audience of millennials is comfortable with a price of $11.89.
2. Feature Value
Do you know which features of your product are the most important for your customers? If you’re a SaaS company, this information is useful for packaging your product features into different tiers.
Paddle recommends conducting a tradeoff feature analysis. Instead of asking customers to choose one feature, this involves letting them pick their most favorite and least favorite feature. This will give you more information to understand what your customers care the most about.

There are a couple of more KPIs related to pricing that we’ll explore later in the article.
2. Market Size Analytics
Is there sufficient growth potential for your products and services? You need to know the size of the market to determine this. Market size analytics help you estimate the ceilings for your sales team.
A few ways to get started include studying industry reports (government sources or otherwise), your top competitors' financial data, and surveying your customers.
if (window.convertflow == undefined) {
var script = document.createElement('script');
script.async = true;
script.src = "https://js.convertflow.co/production/websites/10698.js";
document.body.appendChild(script);
};
3. Non-Customer Analytics
Instead of understanding your customers, non-customer analytics focuses on identifying people who aren’t buying from you and getting their qualitative feedback through open-ended questions.
How is it valuable for you?
Your churning customers can reveal fundamental flaws and unmet needs in the product. You might also find an opportunity to expand your business. So, email them questionnaires or call them directly to get constructive feedback.
Pro Tip: Leverage
to create interventions and prevent the occurrence of common customer problems.
4. Competitor Analytics
A key piece of information that can improve your product performance is understanding how your competitors stack up against you. You can leverage competitor analysis tools, business journals, and the like to gain intelligence on whom you’re against and what they are doing better.
But nothing beats calling your competition as their prospect and analyzing how they pitch their product. Such analytics can reveal the changes you must make in your pitch, pricing, and product.
5. Pipeline Velocity
How much revenue do you have per sales cycle, and how quickly are leads moving through your funnel? Here’s the formula for pipeline velocity (PV) that tells you these aspects:

Source: InsightSquared
Any change in your opportunities, win rate, deal size, and sales cycle length will affect PV, enabling targeted improvements to your sales process. However, you need to dissect the root cause of the spikes and drops in these metrics.
If you want to increase your sales speed and drive more revenue in less time, assess the above variables, evaluate how to improve these individual numbers, make your sales process more efficient, and improve your sales coaching.
And that’s how you build a better and fast-moving sales team!
Pro Tip: Close automates your workflow and clearly shows your expected revenue through its pipeline view (customizable to your sales process). Start here to get a handle on your PV.

6. Sales Channel Analytics
Do you know which channels are the most effective in raising product revenue? If you don’t, it’s time to evaluate which channels are working, which ones you need to stop spending time on, and which channels present new opportunities.
It’s easier to analyze online channels as most marketing and sales tools have analytics baked into the product. On the other hand, offline channels require careful documentation of metrics to identify patterns and evaluate performance.
Ultimately, this analytics is about understanding your growth and profit margins from every channel to measure their effectiveness.
Pro Tip: Different segments of your market might drive results from different channels. So don’t dismiss a channel as ineffective too fast.
7. Sales Forecasting Analytics
Forecasting customer demand for your products helps you understand your business's future. Such sales forecast analysis is usually performed by leveraging historical sales data. It enables sales leaders to predict revenue numbers and make informed business decisions on advertising, hiring, etc.
Sales managers can use it to check the pulse on business-generating activities and mobilize SDRs to take calculated actions to arrive where they want.
I’ve already shared numerous sales forecasting templates for you to get started. If you’re a startup, then you can also refer to these sales forecasting strategies for accurate forecasting.
8. Brand Analytics
Branding isn’t simply about creating branding guidelines about using your assets. It’s about how your customers perceive your company and the products. Brand analytics helps you compare your brand’s image with the competition.
For quantitative data, you can log into your Google Analytics account and check the percentage of branded traffic, source of visits, repeat visitors, etc.

Source: SlideShare
To get relevant data for brand analytics, remember to collect qualitative information through blogs, surveys, reviews, customer service and sales conversations, social media mentions, and the like.
You’ll learn key performance metrics related to the above nine types of sales data analytics later. Next, look at ready-to-use dashboards and templates for conducting a sales analysis.
Sales Analytics Examples, Templates, and Dashboards
Now that you’re ready to conduct sales analytics, here are some real-world examples for inspiration.
Current Status Dashboard

Want a quick overview of your sales reps' current workflow? Use this dashboard to view important metrics about calls, emails, and SMS. Also, check whether your sales numbers are going down or up compared to the previous month.
Resource Type: Dashboard
Why use this? It will help you quickly understand your ongoing sales efforts and where you need to focus to improve important performance metrics.
Sales Leaderboard Dashboard
The leaderboard shows key performance metrics for your sales team and the individual performance of every rep. It provides a real-time overview of any sales metric, allows you to benchmark an individual’s performance, and creates healthy competition in your team.
Resource Type: Dashboard
Why use this: You can motivate your sales team to reach their targets.
ZAP Sales Performance Dashboard

Source: Zap
You can integrate your ERP and CRM data to get a 360-degree view of your sales performance. This view shows almost all business-related aspects, including your liquidity over time, lead sources, opportunity amount, gross margin over time, performance, profitability, and more.
Resource Type: Dashboard
Why use this? You can automate sales data preparation tasks (from multiple sources) and get cross-functional sales business intelligence.
Sales Opportunities Pipeline Dashboard
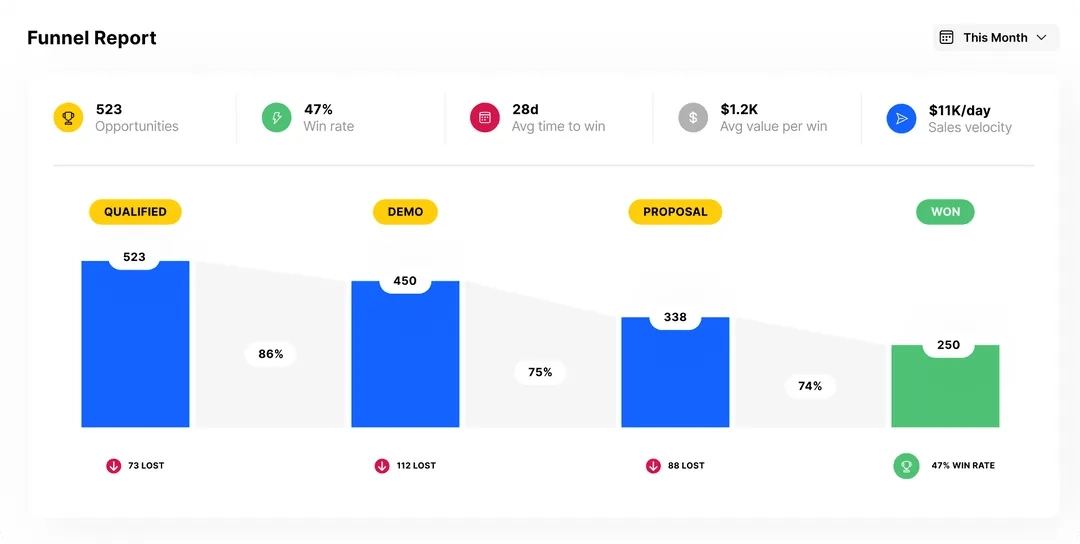
This dashboard provides a high-level view of the current deals in your pipeline. It also shows their expected value, the confidence level of the deal, and the reps who brought them in. Sales managers can leverage it to understand trends, keep the team organized, and conduct sales activities to ensure a healthy pipeline.
Resource Type: Dashboard
Why use this? You should know the current status of the deals in your pipeline and their value to your company.
Business Dashboard

Source: Zoho
Get elegant visual insight into your business's key metrics, including revenue, expenses, profit, lead conversion funnel, lead conversions by industry and source, and more.
Resource Type: Dashboard
Why use this: Visually analyze and build sales analysis reports with key performance indicators related to your business.
Monthly Sales Report Template

Source: RIB
Track the business metrics of utmost importance, like your number of sales, revenue, churn rate, profit, cost, and the like, monthly with this template. The C-suite can use this operational and strategic data to monitor the sales organization's performance.
Resource Type: Template
Why use this? To get a handle of the high-level metrics that might indicate a need for change in your sales strategy.
Eventbrite Events Template

Source: Databox
Are you planning a big event like a conference? Then, use this template to track the key metrics, including tickets sold, gross sales, sales by ticket type, and other event stats.
Resource Type: Template
Why use this? You can monitor your event stats, the most popular tickets, and your progress towards hitting your sales target.
Sales Forecast Dashboard

Source: Tableau
With this sales analytics dashboard, sales teams understand how they are faring and determine if they will hit their quota. You can even compare the forecast to your quota and explore the best-case vs. the commit-case forecast.
Resource Type: Dashboard
Why use this? Sales teams can create their quarterly forecasts and compare YoY performance with them.
Sales Product Performance Dashboard

Source: Klipfolio
Want to know your top-selling product and the channels that contribute to maximum sales? Then, this dashboard is for you. You can also access incremental sales through the campaign, the cost of goods sold, point of purchase, and product performance.
Resource type: Example
Why use this? Find out which of your products are selling the best and which are lagging.
Sales Dashboard for Individual Sales Rep

Source: Keen.io
This is a powerful sales dashboard that individual reps can use to track their progress through metrics such as meetings booked, sales opportunities, deals won, close rate, time tracking, and the like. They can even compare their performance with previous days, weeks, or months to analyze whether they are improving.
Resource type: Example
Why use this? It gives your sales reps a visual overview of their performance with actionable intelligence on where they need to double down their efforts.
Executive Dashboard: Quarterly Retrospective

Source: InsightSquared
Want to understand how your business fared last quarter and where you failed to achieve your goals? Then, the executive dashboard is what you need. You can analyze the bookings made by your sales team, identify your most valuable products and marketing campaigns, understand the reason for the loss of opportunities, and analyze your quarter’s performance compared with recent history.
Resource type: Example
Why use this? It’s a great starting point for your quarterly business review.
You can explore more sales dashboard examples and templates here.
5 Sales Analytics Tools & Software That Make the Process Easier
While analytics tools are great, you need to ensure they deliver useful information. A study by Harvard Business Review found that 83 percent of metrics on sales dashboards are unmanageable (i.e., reps cannot use it right away).
Below are five sales analytics tools that present sales data that your reps can directly use to improve their performance.
1. Close

Close has a powerful inbuilt reporting feature that presents actionable insights. You can monitor key metrics, understand what your customers value, benchmark your top-performing sales reps, and more, all inside this sales CRM.
How It Helps You Master Sales Analysis: Take out manual data entry out of your sales operations, make your organization more productive, and bring more success to your team.
2. Zoho Analytics

It lets you visually analyze your sales CRM data and generates helpful reports/dashboards to track key performance indicators. You can complement your existing sales process with its sales analytics capabilities to identify the weaknesses in your performance, growth opportunities, and much more.
How It Helps You Master Sales Analysis: Simply sync your CRM data to build powerful sales analysis reports and dashboards through its drag-and-drop interface.
3. InsightSquared

This tool offers sales performance analytics, sales pipeline analytics, and other sales reports with actionable information for revenue operations professionals. You can also use it to give personalized coaching to your sales reps.
How It Helps You Master Sales Analysis: It lets you visualize your historical sales trends and set accurate sales forecasts and goals for your team.
4. Clari

Want to improve your sales execution? Clari is the perfect tool to access actionable analytics in real time. Sales managers can leverage it to instantly spot risks and direct their reps to focus on the right deals. Sales leaders can track their KPIs in one place to quickly get an overview of their week-over-week performance in the quarter.
This tool uses artificial intelligence-based predictive analytics to eliminate guesswork in sales forecasting and monitor the health of your pipeline. It even assigns an opportunity score indicating the likely winning deals.
How It Helps You Master Sales Analysis: It syncs data from dozens of business systems (like your CRM, email, and other similar systems) and uses AI to drive predictable revenue for your business.
5. Looker

This cloud-based tool empowers your sales team with smart insights on sales forecasting, quota attainment, and sales activities that bring more revenue. It uses real-time data to visualize your sales performance that you can share and collaborate with your team easily.
How It Helps You Master Sales Analysis: The browser-based real-time business analytics tool enables efficient and effective performance for your sales team, allowing them to focus on the deals that drive more revenue.
18 Sales Analytics Metrics & KPIs to Start Tracking
Here’s a look at a few important sales KPIs fundamental to sales analytics success. I’ve clubbed related metrics into pairs for your convenience.
Monthly Sales Growth and New MRR
These are foundational business metrics. Monthly sales growth measures the increase in your sales revenue every month. A new MRR tells you the recurring revenue you added this month by acquiring new customers or lowering your acquisition cost.
Sales Opportunities Created and Pipeline Value
Sales opportunities created determine the number of opportunities a rep is creating. Pipeline value tells you the value of the current deals in your pipeline. Both are great ways to gauge the health of your pipeline.
Customer Lifetime Value (CLV), Customer Acquisition Cost (CAC), and Average Purchase Value
CLV measures the revenue you generate in the lifetime of an average customer. This value is important for determining what you should spend on acquiring new customers (CAC).

The average purchase value tells you how much a customer spends on your products. Optimizing your sales process and increasing this KPI would multiply the results of your efforts.

Product Performance
The KPI tells you how an individual product is performing. It becomes important when you sell multiple products. However, you need additional contextual information like experimentation in your sales strategy, the release of a new product by your competitor, and the like.
Lead Conversion Rate and Average Conversion Time
Lead conversion rate is a useful KPI for a high-level overview of your sales team's performance and pitch effectiveness. The average conversion time tells you the productivity of your sales funnel by indicating the amount of time it takes to convert a lead.
Calls and Emails per Rep and Sales Leaderboard
Do you know the number of people your SDRs are talking to? The first metric gauges the volume of calls and emails your sales team makes over a specific time frame (week, month, or year).
The leaderboard gives you real-time insights into individual members' performance and induces friendly competition in your sales team.

Sales targets and retention & retention/churn rates
Nothing will motivate and rally your sales team better than realistic targets. So, ensure that you use historical data to set attainable goals for them.
Modern sales, especially for SaaS companies, isn’t simply about onboarding customers. Retention and churn are the KPIs that should be used to track your lost customers and revenue over time.
Sales by Contact Method and Sales by Region
Do you know the contact methods that are the most successful in generating sales for your product? The sales by contact method tells you the outreach method most likely to generate sales for your company.
Sales by region, similarly, find out the geographies in the world where your customers are coming from and the markets that are most valuable for your company.
Average Profit Margin
While revenue is great, profits lead to a company's growth. The average profit margin tells you your average profit across all your products, services, bundles, and sales channels.
Most of the KPIs mentioned above will need additional contextual information to find a larger, meaningful trend and a corresponding actionable.
Elevate Sales Performance with Data-Driven Insights and Strategic Cadence Adjustments
Sales analytics can reveal hidden relationships and trends in your sales data that can substantially improve your performance.
However, gleaning crunched numbers in a spreadsheet is daunting for most executives. So, you can leverage sales analytics tools that present the information in an easily consumable visual format.
It’s time to create your first sales analysis report. Pick a software and a few relevant sales analytics metrics, and use a resource from this article to get started!
Some CRMs take months to implement. With Close, you can set up or migrate in under 10 minutes. Want to test it out? We've got a 14-day free trial with your name on it.
.webp)